Love at First Bite: How Americans Are Dining This Valentine’s Day
valentines day dining

Love at First Bite: How Americans Are Dining This Valentine’s Day

January 28th, 2025

Valentine’s Day isn’t just about roses and chocolates – it’s also one of the most popular days of the year for dining out. But how are Americans planning to celebrate over a meal this year? We surveyed over a thousand American adults and asked questions from how much people are willing to spend to whether they’re opting for fine dining, casual takeout, or a cozy meal at home. With preferences spanning romantic dinners for two, group outings, and even solo celebrations, this year’s data paints a vivid picture of how love is shared through food – and what’s driving these decisions. Let’s dive into the trends shaping Valentine’s Day dining in 2025.

Top 10 Key Findings

1. 67% are planning to dine out on Valentine's Day in 2025

Dining out on Valentine's Day 67.1%

67.1% of American adults are planning to dine out during this year’s Valentine’s Day.

2. 55.3% of adults are planning dine with their romantic partners on Valentine's Day

55.3% plan to dine with their romantic partners while 23.5% plan to dine with family and 21.2% with friends on Valentine’s Day this year.

3. 60% are expecting to spend between $50-$100 per person on Valentine's Day dining

$50-$ 50

60% plan to spend $50-$100 per person on dining out during Valentine’s Day in 2025. 25.9% plan to spend $25-$50 while 12.9% expect to spend $100+ per person.

4. 71.8% expect to spend more on dining on Valentine's Day this year compared to 2024

Will spend more on dining in 2025 71.8%

71.8% expect to spend more while 18.8% expect to spend less and 9.4% expect to spend the same as previous year’s Valentine’s Day.

5. Casual dining is the most popular dining option with 38.8%

38.8% of adults prefer casual dining on Valentine’s Day while 22.4% prefer fine dining and 25.9% prefer fast food dining as celebratory meals option on Valentine’s Day 2025.

6. 42.4% will dine out at local/independent restaurants instead of chain restaurants

0 %

56.5% prefer chain restaurants as dining out option while 42.4% prefer local/independent restaurants for Valentine’s Day.

7. American cuisine is the most preferred cuisine type by 77.6%

American Cuisine 77.6%

77.6% prefer American cuisine on Valentine’s Day, 7.1% prefer Italian cuisine and 7% prefer Asian cuisine. Other mentioned cuisine categories include Mexican and Seafood cuisines.

8. Valentine's Day menu specials is the most important factor in bringing customers to a restaurant.

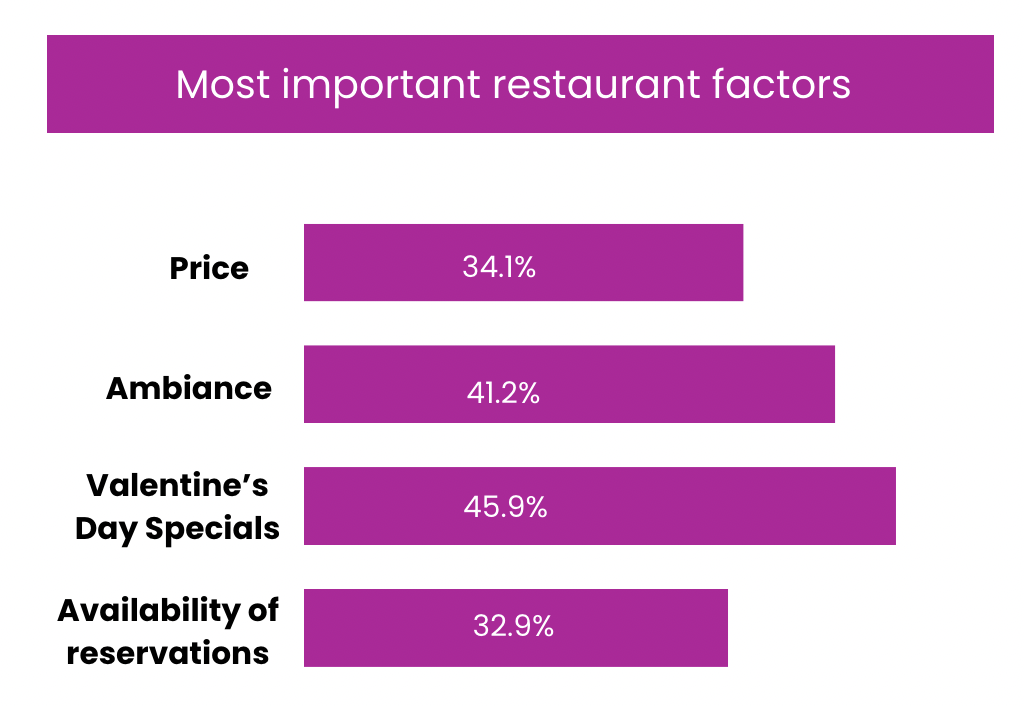
Valentine’s Day menu specials are cited by 45.9% as an important factor in determining whether they will dine out a particular restaurant. Ambience (41.2%), price (34.1%) and availability of reservations (32.9%) are also frequently cited factors in determining customers’ restaurant choice on Valentine’s Day.

9. 81.2% are more generous tippers on Valentine's Day

0 %

81.2% are expecting to tip more on Valentine’s Day compared to regular dining out. Only 18.8% are going to tip the same or less.

10. 47.1% make restaurant reservations for Valentine's Day 2-4 weeks in advance

2-4 weeks in advance 47.1%

47.1% make restaurant reservations for Valentine’s Day 2-4 weeks in advance while 29.4% make restaurant reservations 1 week in advance. 12.9% make restaurant reservations 4+ weeks in advance and 10.6% make reservations same day.

Demographics

The demographic composition of American adults surveyed can be found below and is categorized by age, gender and income.

Gender

Age

age

Income

income

Methodology

For the purpose of this survey, we surveyed 1084 adults across America to assess their dining preferences for this year’s Valentine’s Day. The survey was carried out on January 23rd, 2025 using Survey Monkey services.

If you have any questions or issues with the data presented in this report, please contact us.

Get The Latest Restaurant Trends, Guides & Tips